It has been awhile since I posted about Anomaly detection using F# and ML.NET. Since the ML.NET framework continues to evolve, so it is worth a revisit to investigate changes. This also provides a good opportunity to dig deeper into the anomaly detection options that are provided.
Setting up dependencies is a two-part process, depending on the operating system. First, add the necessary packages. Second, Mkl.Redist may require an additional library install. Microsoft has details at install extra dependencies for the specific requirements, but I include an example of installing and loading the library on Ubuntu.
Last time I used the Dow Jones stock index for my example. This time I’m going to shift a bit, and use the NASDAQ index. I’m using the same data format as before, below is a snippet of the source data. It is extensive stock price data, but I will only use Date and Close price today. It was exported from Yahoo! Finance.
Before I get into the detection, there is some work to be done. First is setting up the MLContext that will be used in the transformations and detections. I will also load the actual price data into its own array and chart,, so I can use it in the final display phase later.
let data = context .Data .LoadFromTextFile<PriceData> ( path = dataPath, hasHeader = true, separatorChar = ',')
/////////////// // Pricing data
let priceData = context .Data .CreateEnumerable<PriceData>(data, false) |> Seq.map (fun x -> (x.Date, float (x.Close)))
let priceChart = Chart.Line(priceData, Name = "Price")
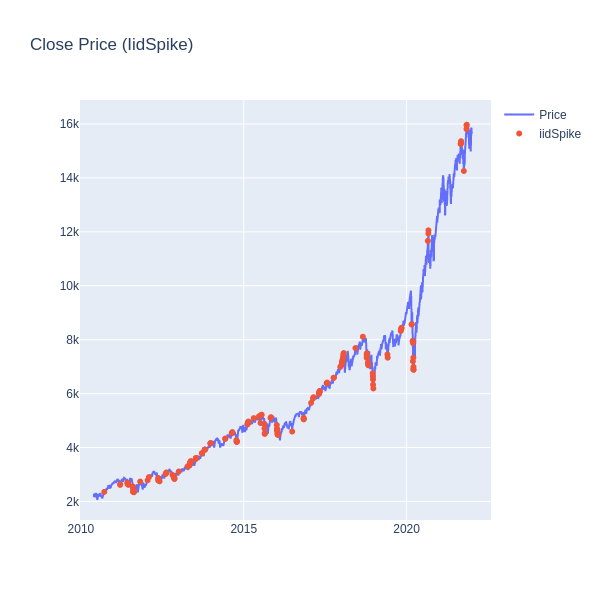
The first anomaly detection method to look at is IidSpike. This is the method used in the original post. Creating an anomaly detector hasn’t changed too much between versions. There are a couple small parameter issues, but the transition is pretty clean. As is often the case, the values for confidence and pvalueHistoryLength can/will be situation dependent, but for example purposes these work reasonably well. After determining the anomalies for the data, I pair the detected anomalies with the price data for a chart.
let iidSpikeAnomalies = context .Data .CreateEnumerable<PricePrediction>(iidSpikeData, reuseRowObject = false)
let iidSpikeChartData = (priceData, iidSpikeAnomalies) ||> Seq.zip |> Seq.map (fun (p, a) -> // For all anomalies, use closing price to show on the chart (a.Date, if (a.Prediction).[0] = 0.then None else Some (snd p))) |> Seq.filter (fun (_x, y) -> y.IsSome) |> Seq.map (fun (x, y) -> (x, y.Value))
let iidSpikeChart = Chart.Scatter (iidSpikeChartData, StyleParam.Mode.Markers, Name = "iidSpike")
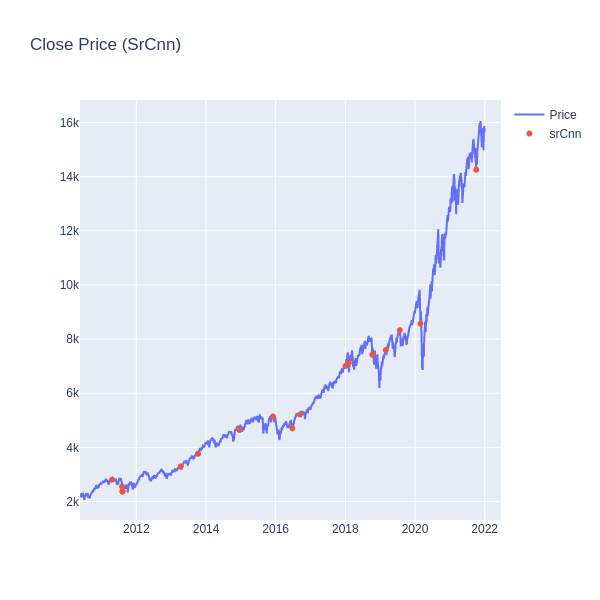
One of the main goals of this posts is to investigate additional anomaly detection methods that ML.NET provides. The second anomaly detection method to look at is SrCnn. Its methodology is based on leveraging Spectral Residual and a Convolutional Neural Network. You can read more details on the underlying mechanisms and reasoning on their website SrCnnAnomalyEstimator and whitepaper Time-Series Anomaly Detection Service at Microsoft. Below is a pipeline for detection using SrCnn. One takeaway is the code is nearly identical to the IidSpike example; just replace the DetectIidSpike call with DetectAnomalyBySrCnn. Perhaps this isn’t surprising, but it makes experimentation easy as snapping pieces in and out. Since the parameter support is different for the calls there is a bit more work. I’m only using windowSize to define the sliding window, but it does have more knobs (like threshold) to tweak. Like before, I pair the detected anomalies with the price data for a chart.
let srCnnAnomalies = context .Data .CreateEnumerable<PricePrediction>(srCnnData, reuseRowObject = false)
let srCnnChartData = (priceData, srCnnAnomalies) ||> Seq.zip |> Seq.map (fun (p, a) -> // For all anomalies, use closing price to show on the chart (a.Date, if (a.Prediction).[0] = 0.then None else Some (snd p))) |> Seq.filter (fun (_x, y) -> y.IsSome) |> Seq.map (fun (x, y) -> (x, y.Value))
let srCnnChart = Chart.Scatter (srCnnChartData, StyleParam.Mode.Markers, Name = "srCnn")
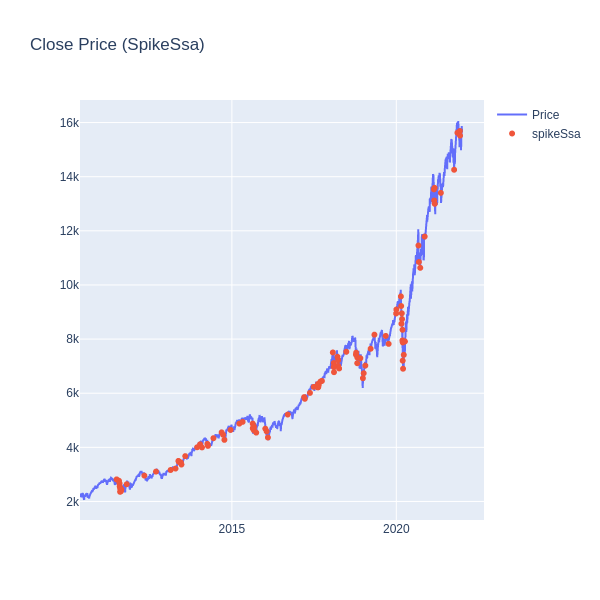
The next anomaly detection method up for experimentation is spikeSSa. This method uses Singular spectrum analysis to detect anomalies. Microsoft has more details regarding its methodology at SsaSpikeEstimator and with the whitepaper Basic Singular Spectrum Analysis and Forecasting with R. As with SrCnn, I can snap in the DetectBySsa estimator into the pipeline. This does have more knobs to tweak, so some experimentation is worthwhile to determine the best settings for your particular situation. Once detected, I link the anomalies with the data to make a nice chart.
let spikeSsaAnomalies = context .Data .CreateEnumerable<PricePrediction>(spikeSsaData, reuseRowObject = false)
let spikeSsaChartData = (priceData, spikeSsaAnomalies) ||> Seq.zip |> Seq.map (fun (p, a) -> // For all anomalies, use closing price to show on the chart (a.Date, if (a.Prediction).[0] = 0.then None else Some (snd p))) |> Seq.filter (fun (_x, y) -> y.IsSome) |> Seq.map (fun (x, y) -> (x, y.Value))
let spikeSsaChart = Chart.Scatter (spikeSsaChartData, StyleParam.Mode.Markers, Name = "spikeSsa")
Now that we’ve gone over these three methods, you can see from their charts they have differing sensitivies to anomalies. This doesn’t even take into account hyperparameter optimization for options such as window-size, confidence, and ovaluehistory. As always, its great to have options, and I’ve found that depending on my needs I graviate to different methods. This has been a short foray into additional anomaly detection methods provided by ML.NET. Examples can go a long way to help wrapping your head around the possiblities. I hope you found this useful in your ML.NET projects, or perhaps has intrigued you enough to try it. Until next time.