Taking Stock of Anomalies with F# and ML.NET

Read Time: 8 minutes

Today’s task is to analyze stock prices, specifically price anomalies. Recently ML.NET hit version 1. So what better way than to use F# and ML.NET.

As always, the preliminaries. For the initial setup, make sure you have .NET Core version 2.2 installed. If you don’t, head out to the .NET Core Downloads page. Select SDK for your platform. The specific methods will use the ML.NET TimeSeries package. At the time of this writing, it is v0.12, so it hasn’t hit version 1 yet, but it works well enough. Once that is complete, create a console F# project, then add the necessary ML.NET and Charting packages.

1
2
3
4
5
dotnet new console --language F# --name MLNet_StockAnomaly
cd MLNet_StockAnomaly
dotnet add package Microsoft.ML --version 1.0.0
dotnet add package Microsoft.ML.TimeSeries --version 0.12.0
dotnet add package XPlot.GoogleCharts --version 2.0.0

In order to not pick on one particular stock, the Dow Jones index over the past year will be the target of interest. Below is a sample of what the data extract looks like. It is the basic stock price data to be expected, including date, prices, and volume. This article will only need Date and Close price. It was exported from Yahoo! Finance.

1
2
3
4
5
6
7
8
# Data Rows
Date,Open,High,Low,Close,Adj Close,Volume
2018-05-22,25047.550781,25064.990234,24812.060547,24834.410156,24834.410156,288200000
2018-05-23,24757.710938,24889.460938,24667.119141,24886.810547,24886.810547,399610000
2018-05-24,24877.359375,24877.359375,24605.900391,24811.759766,24811.759766,347050000
2018-05-25,24781.289063,24824.220703,24687.810547,24753.089844,24753.089844,257210000
2018-05-29,24606.589844,24635.179688,24247.839844,24361.449219,24361.449219,395810000
2018-05-30,24467.830078,24714.480469,24459.089844,24667.779297,24667.779297,324870000

Time to start the code. First, I need to setup the necessary namespaces and types. These cover the ML.NET namespaces as well as XPlot for charting the results. When using ML.NET, the easiest way to interact with the data is by defining two types. PriceData matches the datafile schema. PricePrediction is for the model results, in this case I’ll use it for both anomaly detection and change point detection results. The Prediction field is an array containing a 0 or 1 for a detected event, the value at that datapoint, and its respective confidence level.

1
2
3
4
5
6
7
8
9
10
11
12
13
14
15
16
17
18
19
20
21
22
23
24
25
26
27
28
29
30
31
32
33
34
35
36
37
38
39
40
open Microsoft.ML
open Microsoft.ML.Data
open Microsoft.ML.Transforms.TimeSeries
open XPlot.GoogleCharts

type PriceData () =
[<DefaultValue>]
[<LoadColumn(0)>]
val mutable public Date:string

[<DefaultValue>]
[<LoadColumn(1)>]
val mutable public Open:float32

[<DefaultValue>]
[<LoadColumn(2)>]
val mutable public High:float32

[<DefaultValue>]
[<LoadColumn(3)>]
val mutable public Low:float32

[<DefaultValue>]
[<LoadColumn(4)>]
val mutable public Close:float32

[<DefaultValue>]
[<LoadColumn(5)>]
val mutable public AdjClose:float32

[<DefaultValue>]
[<LoadColumn(6)>]
val mutable public Volume:float32

type PricePrediction () =
[<DefaultValue>]
val mutable public Date:string

[<DefaultValue>]
val mutable public Prediction:double[]

Once that is done, it is time for the processing pipeline. This includes creating the pipeline context and hooking up the data to the file.

To process the data, there will technically be two pipelines. The first will use the IidSpike trainer for anomaly detection. The second will use the IidChangePoint trainer for change point detection. To get the best results, these aren’t really fire and forget approaches. There are a couple dials to adjust. The pvalueHistoryLength defines the sliding window size that is applied when looking for events. Since this is stock data, multiples of 5 roughly correlate to weeks. So at anomalies over 6 week windows, and change points over 2 week windows. Additionally, confidence is on a scale 0-100, higher values requiring a higher level of confidence to trigger an event. Another dial to turn is AnomalySide to detect either only postive, only negative, or all anomalies. The default is all, but it’s nice to have options. All of these values should be adjusted to best meet the needs of the dataset and desired data analysis.

Once the pipelines are created, they need to be trained with the Fit method. Now there is a model that can be used. Transform will take the dataset and apply the model to build out predictions for the events.

1
2
3
4
5
6
7
8
9
10
11
12
13
14
15
16
17
18
19
20
21
22
23
24
25
26
27
28
29
30
31
32
33
34
35
36
37
38
39
40
41
42
43
44
45
46
47
48
49
50
51
52
let dataPath = "dji.csv"

let ctx = MLContext()

let dataView =
ctx
.Data
.LoadFromTextFile<PriceData>(
path = dataPath,
hasHeader = true,
separatorChar = ',')

let anomalyPValueHistoryLength = 30
let changePointPValueHistoryLength = 10
let anomalyConfidence = 95
let changePointConfidence = 95

let anomalyPipeline =
ctx
.Transforms
.DetectIidSpike(
outputColumnName = "Prediction",
inputColumnName = "Close",
side = AnomalySide.TwoSided,
confidence = anomalyConfidence,
pvalueHistoryLength = anomalyPValueHistoryLength)

let changePointPipeLine =
ctx
.Transforms
.DetectIidChangePoint(
outputColumnName = "Prediction",
inputColumnName = "Close",
martingale = MartingaleType.Power,
confidence = changePointConfidence,
changeHistoryLength = changePointPValueHistoryLength)

let trainedAnomalyModel = anomalyPipeline.Fit(dataView)
let trainedChangePointModel = changePointPipeLine.Fit(dataView)

let transformedAnomalyData = trainedAnomalyModel.Transform(dataView);
let transformedChangePointData = trainedChangePointModel.Transform(dataView);

let anomalies =
ctx
.Data
.CreateEnumerable<PricePrediction>(transformedAnomalyData, reuseRowObject = false)

let changePoints =
ctx
.Data
.CreateEnumerable<PricePrediction>(transformedChangePointData, reuseRowObject = false)

Now that the data has been processed, it is time to build some charts and look at the results. At this point, it is an exercise of formatting the data for charts, a (Date * float32) list. There are 3 datasets: prices, anomalies, and change points. Using XPlot, they are combined into a single chart. The only trick here is I remove the non-events from the prediction datasets and plot their points directly on the price line chart.

1
2
3
4
5
6
7
8
9
10
11
12
13
14
15
16
17
18
19
20
21
22
23
24
25
26
27
28
29
30
31
32
33
34
35
// Build chart data
let priceChartData =
anomalies
|> Seq.map (fun p -> let p' = float (p.Prediction).[1]
(p.Date, p'))
|> List.ofSeq

let anomalyChartData =
anomalies
|> Seq.map (fun p -> let p' = if (p.Prediction).[0] = 0. then None else Some (float (p.Prediction).[1])
(p.Date, p'))
|> Seq.filter (fun (x,y) -> y.IsSome)
|> Seq.map (fun (x,y) -> (x, y.Value))
|> List.ofSeq

let changePointChartData =
changePoints
|> Seq.map (fun p -> let p' = if (p.Prediction).[0] = 0. then None else Some (float (p.Prediction).[1])
(p.Date, p'))
|> Seq.filter (fun (x,y) -> y.IsSome)
|> Seq.map (fun (x,y) -> (x, y.Value))
|> List.ofSeq

// Show Chart
[priceChartData; anomalyChartData; changePointChartData]
|> Chart.Combo
|> Chart.WithOptions
(Options(title = "Dow Jones Industrial Average Price Anomalies",
series = [| Series("lines"); Series("scatter"); Series("scatter") |],
displayAnnotations = true))
|> Chart.WithLabels ["Price"; "Anomaly"; "ChangePoint" ]
|> Chart.WithLegend true
|> Chart.WithSize (800, 400)
|> Chart.Show

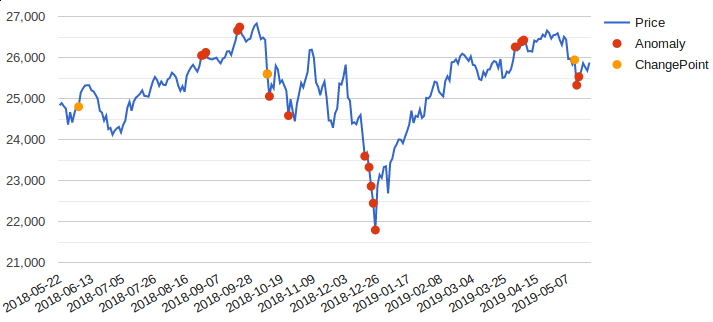
Here is the resulting Dow Jones price chart for the last year, using the defined models. Based on the sliding windows and required confidence levels, there are now potentially useful events.

Price Chart (Take 1)

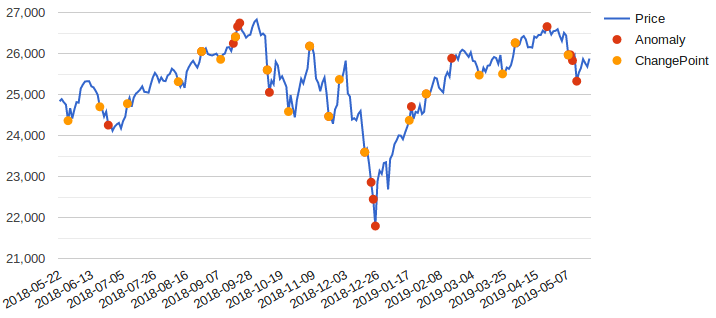
Charts offer a convenient way to see how some of those earlier parameters can impact the result. I’ve reduced the sliding windows by half to 15 (3 weeks) and 5 (1 week), anomaly and changepoints, respectively. The below chart shows the results of the change. The anomalies haven’t changed too much, but the changepoints are much more reactive to direction changes. One key take away here is there isn’t a single right configuration. It is imperative to understand what types of outliers and attributes are important.

Price Chart (Take 2)

I hope you have found this short look into timeseries processing using ML.NET useful.