Web Scraping with F#

Read Time: 6 minutes

Not surprisely, F# is a useful tool for all sorts of random tasks, web scraping among them. Today I’ll take a quick side-track and leverage F# to web scrap some COVID-19 data and create some charts.

Pennsylvania provides daily COVID-19 stats on their website. This is great, but there are charts I’d like to see that they don’t provide. This is easy enough to resolve by doing my own data collection and charting; enter web scraping. As anyone who has done it before, they know scraping data can sometimes be a messy and error-prone process. Luckily FSharp.Data provides some useful HTML parsing capabilities to make this process easier. I would also be remiss if I didn’t mention, github.com/tomswartz07 inspired me to whip this little project together. He uses Python, but I borrowed his data identification method, with a few F#-style improvements. Ok, time to do some setup.

1
2
3
4
dotnet new console -lang F# -n Covid19
cd Covid19
dotnet add package FSharp.Data
dotnet add package XPlot.GoogleCharts --version 3.0.1
1
2
3
4
open System
open System.IO
open FSharp.Data
open XPlot.GoogleCharts

As with most web scraping, this can be a touchy and/or dirty process. Luckily in this particular case the data is relatively simple to parse. I just need to grab the table rows <tr>. I can then transform each row’s set of <td> into an array of strings. After that I just need to filter to only the rows I want. Again, I luck out with some pretty easy demarcation of the desired rows. The page reports at the county level detail, but I only feel like tracking totals for the state. As a result, I’ll do some some quick column level summing. This will take the target webpage down to a timestamped row of data.

1
2
3
4
5
6
7
8
9
10
11
12
13
14
15
16
17
18
19
20
21
22
23
24
25
26
27
28
29
30
31
32
let getData () =
let url = "https://www.health.pa.gov/topics/disease/coronavirus/Pages/Cases.aspx"
let page = HtmlDocument.Load(url)
// Note: target row format is: County,Positives,Negatives,Deaths

let timestamp = DateTime.Now.ToString("MM-dd")

let aggregatedStateData =
// Grab the html rows
page.Descendants ["tr"]
// Transform data (convert each html row into an array)
|> Seq.map (fun htmlRow ->
htmlRow.Descendants["td"]
|> Seq.map (fun x -> x.InnerText())
|> Seq.toArray)
// Skip rows prior to the section I want
|> Seq.skipWhile (fun row -> Array.isEmpty row || row.[0] <> "County")
// Take data from my section until I reach the next section
|> Seq.takeWhile (fun row -> not (Array.isEmpty row) && row.[0] <> "Sex")
// Skip section header
|> Seq.skip 1
// Sum all county data into a singular state record
|> Seq.map (fun row -> row.[1..3] |> Array.map (fun (x:String) -> int(x.Replace(",",""))))
|> Seq.fold (fun a x -> [| a.[0] + x.[0]; a.[1] + x.[1]; a.[2] + x.[2] |]) [|0; 0; 0|]
// Convert sequence to a csv string
|> (fun row ->
row
|> Array.map (fun x -> x.ToString())
|> String.concat ","
|> (fun data -> sprintf "%s,%s" timestamp data))

(timestamp, aggregatedStateData)

Once I have the data, I need to store it. Since this is meant to be lightweight, I’ll just drop the data to a csv. I want the script to be able to run multiple times a day, but I don’t want multiple date entries. Using a Map keyed by timestamp is a simple solution. More robust or performance sensitive solutions would call for at least something like SQLite, but a csv is good enough for now.

1
2
3
4
5
6
7
8
9
10
11
12
13
let insertData dataFile =
let (timestamp, todaysData) = getData()

// Update current state from file with new information
let stateData' =
File.ReadAllLines(dataFile)
|> Array.map (fun x -> (x.Split ",").[0], x)
|> Map.ofArray
|> Map.add timestamp todaysData
|> Map.toArray
|> Array.map (fun (k,v) -> v)

File.WriteAllLines(dataFile, stateData')

Once the data is collected, I want to show some simple trending over time. Granted, this has nothing to do with web scraping, but once I have the data I need to show a chart or two. Again, F# offers a decent charting option for quick visualizations.

1
2
3
4
5
6
7
8
9
10
11
12
13
14
15
16
17
18
19
20
21
22
23
24
25
26
let chartData dataFile =
let data =
File.ReadAllLines(dataFile)
|> Array.map (fun row -> row.Split ",")

// Create series with timestamp and corresponding data
let positives = data |> Array.map (fun row -> (row.[0], int row.[1]))
let negatives = data |> Array.map (fun row -> (row.[0], int row.[2]))
let deaths = data |> Array.map (fun row -> (row.[0], int row.[3]))

let options =
Options (
title = "COVID19 - PA",
curveType = "function",
legend = Legend(position = "bottom"),
vAxis = Axis(minValue = 0, viewWindow = ViewWindow(min = 0) ) )

[positives; deaths]
|> Chart.Line
|> Chart.WithOptions options
|> Chart.WithLabels ["Positives"; "Deaths"]
|> Chart.WithSize (800, 400)
|> Chart.Show

let printData () =
printfn "%A" (getData())

The final piece is providing some control to determine what functionality I want to perform.

1
2
3
4
5
6
7
8
9
10
11
12
13
14
15
16
[<EntryPoint>]
let main argv =
let dataFile = "state.csv"

if Array.isEmpty argv then
printfn "Missing argument [insert|print|chart]"
Environment.Exit 1
else
match argv.[0] with
| "insert" -> insertData dataFile
| "print" -> printData ()
| "chart" -> chartData dataFile
| _ -> printfn "Missing argument [insert|print|chart]"
Environment.Exit 1

0

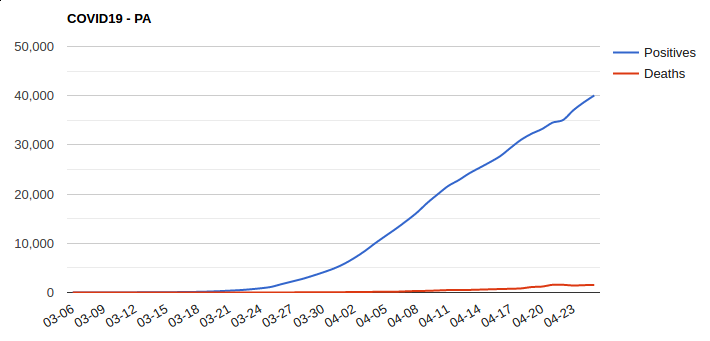
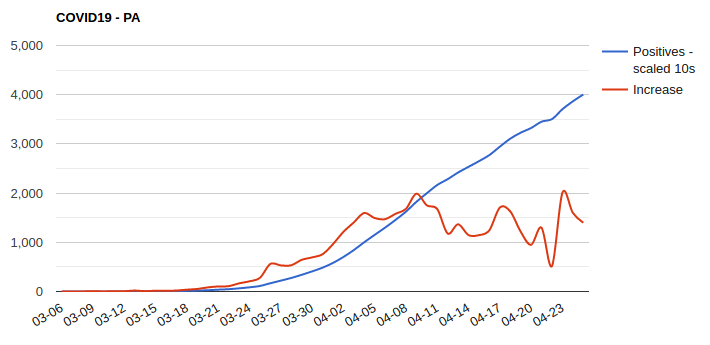
Below are resulting charts from the data. The first is cummulative data over time. The second is the daily increase in positive tests with a cummulative scaled positives overlayed. As the second chart shows, in the beginning of April the daily increases level off (relatively good news, and perhaps a good sign).

Trending

Daily Increase

This has been a brief look into how F# can be used for some quick and dirty web scraping (and charting). It isn’t real sexy, but hacking quick things like this together with F# is a useful tool to have in the toolbox. Until next time.