I’m back to a familar topic, dynamic time warping. This time it’s my excuse to play with Rust.
As a bit of refresher, Dynamic Time Warping (DTW) is a useful mechanism to compare signals, or series, while adjusting for frequency variance. It has turned into one of my go-to algorithms when trying out a new language, Rust is no exception. Today I’m going to explore implementing the DTW algorithm in Rust. My goal is to be as idiomatic as possible, but since this is a learning process, I assume there will be some gaps. Obviously for all this to work I need Rust, installation instructions can be found here.
There is a little setup first. The plan is to read data from csv files, and use gnuplot for some sequence visualizations. As a sidenote, the gnuplot crate assumes gnuplot is installed. So I need to ensure that is installed.
1 | extern crate csv; |
Getting right into the meat of it, here is the dtw implementation. The cost function takes 2 float vectors (and a debug flag) and returns a float as the cost, or difference, between the two sequences. The internal structure that is traversed is a two-dimensional vector, the cost matrix. After the matrix initialization, I iterate through both sequences, comparing and storing cummulative “best” distances. As an initial pass I’m not interested in implementing some of the typical dtw optimizations. That makes this implementation straight-forward, and a good first step.
1 | /// Calculate distance between values |
The algorithm doesn’t do much if it doesn’t have data. I use this an excuse to learn how to use a csv parser. I’m still getting a handle on the best way to deal with errors in Rust. For my purposes printing an error, but filtering out bad data works for me. The goal is to read a csv, and transform the first column into a vector. I then return the resulting vector to eventually be consumed by the previously defined cost function. The csv::ReaderBuilder works well for me out of the box, and it has several more options than I choose to use here.
1 | /// Load a file for processing |
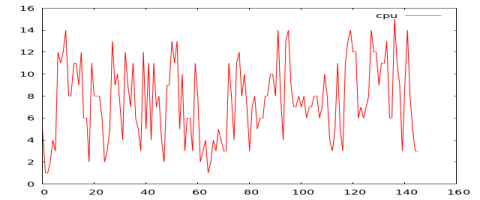
To aid in the development process it is useful to visualize the data. For that I’ll use gnuplot, and thankfully there is a crate for me to use. As mentioned previously, I need to also have gnuplot installed, beyond just the crate. The comparison chart I put together here is pretty basic, but it meets my exploratory needs.
1 | /// Make a chart containing 2 sequences (for comparison) |
Now, I’m finally to the point where I can put it all together. To facilitate flexiblity, I take two csv files at the command line and compare their results. After calculating the cost I create a combined chart of the sequences.
1 | /// main |
With the code complete, it is time to test it out. For that I grabbed some cpu logs from different workloads. To simplify the post I’ll just focus on cpu; although memory, disk, and network are important to workload profiling. The existing algorithm can easily have a modified distance calculation to handle multiple dimensions. Now I just run the app to measure profile similarities and build charts for comparison.
1 | $ cargo run cpu1.csv cpu2.csv |
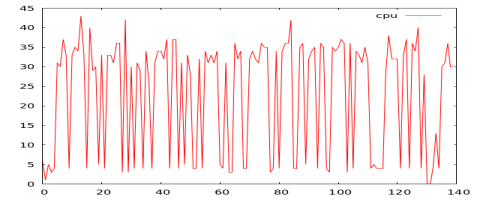
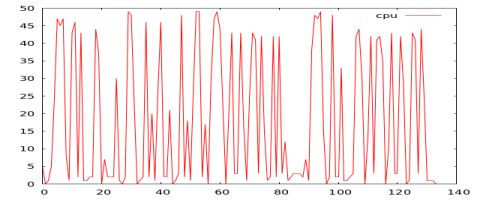
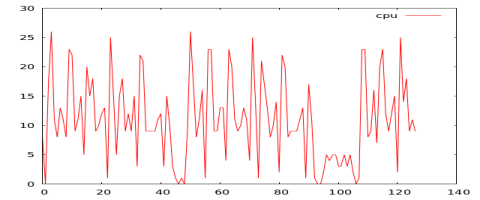
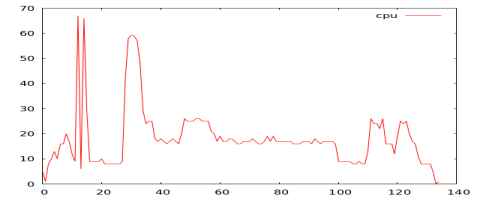
From the chart below, we can see Workloads 3, 4, and 5 have the closest profile. Workloads 1 and 5 have the highest distance difference.
| W1 | W2 | W3 | W4 | W5 | |
|---|---|---|---|---|---|
| W1 | 1212 | 1613 | 2002 | 2218 | |
| W2 | 1572 | 1899 | 1928 | ||
| W3 | 890 | 585 | |||
| W4 | 1075 |
Using Rust for implementing DTW went relatively smoothly. My own code review exposes room for improvement and leveraging Rust better. So I already have some avenues to follow for more learnings. With that said, I’m pleased with how it all came together. Honestly, it’s too early to judge, but I’m thrilled with what I see from Rust. Even though I ran into the typical Rustism snags, coming from a functional background, I felt right at home with many of the idioms. And those snags are just room for growth and part of the learning process. Rust’s approach is solid and I like what I get out of some extra manual effort. Expect more posts as I continue the experiments. Until next time.