K-Means Clustering with F#

Read Time: 13 minutes

The topic for today is leveraging K-Means clustering to perform simple Las Vegas hotel data analysis. This will be done using F# and Accord.NET.

K-Means clustering can be a useful tool when performing data analysis, and F# is an obvious tool for some quick transforms and reporting. This post will use customer satisfaction survey data for several Las Vegas hotels. I will focus on hotel similarity based on available ammenties. Based on this similarity I will then compare hotels against their relative counterparts. The data was obtained from the UCI Machine Learning Repository. This data is from “Stripping customers’ feedback on hotels through data mining: The case of Las Vegas Strip. Tourism Management Perspectives”[1]. If you want to follow along, go out and grab the data. Now, without further delay.

Using Paket, here is the paket.dependencies file.

1
2
3
4
5
6
source https://nuget.org/api/v2
nuget Accord
nuget Accord.MachineLearning
nuget Accord.Math
nuget FSharp.Data
nuget FSharp.Charting

First, setup the libraries and defaults. k will be the number of clusters, which is 5. I’ll go into more detail later why that is my magic number. The datafile is a ; delimited file, and the CSVProvider from FSharp.Data makes loading the data easy money.

1
2
3
4
5
6
7
8
9
10
11
12
13
14
15
16
17
18
19
20
21
22
23
System.IO.Directory.SetCurrentDirectory(__SOURCE_DIRECTORY__)

#r "../packages/FSharp.Data/lib/net40/FSharp.Data.dll"
#r "../packages/FSharp.Charting/lib/net45/FSharp.Charting.dll"
#r "../packages/Accord/lib/net45/Accord.dll"
#r "../packages/Accord.MachineLearning/lib/net45/Accord.MachineLearning.dll"
#r "../packages/Accord.Math/lib/net45/Accord.Math.dll"
#r "../packages/Accord.Math/lib/net45/Accord.Math.Core.dll"
#r "../packages/Accord.Statistics/lib/net45/Accord.Statistics.dll"

open System
open System.IO
open FSharp.Data
open Accord
open Accord.MachineLearning
open Accord.Math

let k = 5

[<Literal>]
let VegasDataFilename = "../data/LasVegasTripAdvisorReviews-Dataset.csv"

type VegasData = CsvProvider<VegasDataFilename, ";">

The data is structured as multiple review instances per hotel. To get the data in the desired format, some quick transformation steps are required. For the First step, group data by Hotel into allData. Second, grab a distinct record for each hotel. For this I use (snd >> Array.head) to extract the first record from each hotel group. Third, aggregate each hotel’s specific scores so an average can be calculated into hotelScores. Finally, grab a list of hotel names for later reporting.

1
2
3
4
5
6
7
8
9
10
11
12
13
14
15
16
17
18
let allData = 
VegasData.Load(VegasDataFilename).Rows
|> Seq.toArray
|> Array.groupBy (fun x -> x.``Hotel name``)

let hotelAmmenities =
allData
|> Array.map (snd >> Array.head)

let hotelScores =
allData
|> Array.map (fun (hotelName, rows) ->
hotelName,
(rows |> Array.averageBy (fun x -> float x.Score)))

let dataNames =
hotelAmmenities
|> Array.map (fun row -> row.``Hotel name``)

There is one final transformation. The Accord.NET K-Means object expects data as an array of arrays of floats. Here I pull out the ammenities that I care about. Does it have a pool, gym, tennis court, spa, casino (you can have a hotel in vegas without a casino?), free internet, and it’s star rating. From the dataset provided, these are the most interesting.

1
2
3
4
5
6
7
8
9
10
11
12
13
14
let boolToFloat x = if x then 1. else 0.

let dataValues =
hotelAmmenities
|> Array.map (fun row ->
[|
boolToFloat row.Pool;
boolToFloat row.Gym;
boolToFloat row.``Tennis court``;
boolToFloat row.Spa;
boolToFloat row.Casino;
boolToFloat row.``Free internet``;
float row.``Hotel stars``
|])

Accord.NET makes the calls pretty easy. Setup a KMeans object with a specified number of clusters, then learn based on the data provided. Since I’m peforming analysis on existing data, I then obtain the cluster labels for my data. If the problem was a prediction problem, clusters would be the object I could use elsewhere for predicting what future hotels are similar to existing hotels. Additionally, the KMeans class provides functionality to evaluate cluster details, such as centroids and error. I’ll dig into these more toward the end.

1
2
3
4
5
6
7
8
let kmeans = KMeans(k)
let clusters = kmeans.Learn(dataValues)
let labels = clusters.Decide(dataValues)

// Model analysis
clusters.Centroids
clusters.Clusters
kmeans.Error

Once the cluster labeling is complete I combine my earlier generated hotelScores with the cluster label for each hotel. Since I kept the data in the same order, it can simply be zipped together as a (<hotelScore>, <cluster #>) tuple.

1
2
3
let combinedData = 
(hotelScores, labels)
||> Array.zip

For comparative analysis, the average hotel review score for each cluster must be obtained. It is a matter of taking the newly created combinedData, grouping by cluster, then averaging the score of each hotel in the cluster.

1
2
3
4
5
6
7
let avgClusterScore = 
combinedData
|> Array.groupBy (fun (scores, cluster) -> cluster)
|> Array.map (fun (cluster, scores) ->
cluster,
(scores |> Array.map (fst>>snd) |> Array.average))
|> Map

This code deserves a bit of an explanation. In my defense, this is a small exercise. In production I try to avoid tuples of tuples of tuples all the way down. This is currently at the border of reasonable readability. Below is a deeper breakdown into what is going on.

1
2
3
4
5
6
7
8
9
10
11
12
13
14
15
16
17
18
19
20
21
22
23
24
25
// Source
combinedData

// Groups by cluster
|> Array.groupBy (fun (scores, cluster) -> cluster)

// Gives something that looks like this:
[|(3,
[|(("Circus Circus Hotel & Casino Las Vegas", 3.208333333), 3);
(("Hilton Grand Vacations at the Flamingo", 3.958333333), 3)|]);
(4,
[|(("Excalibur Hotel & Casino", 3.708333333), 4);
(("Tuscany Las Vegas Suites & Casino", 4.208333333), 4)|]);
...

// Creates a tuple of (<cluster #>, <average cluster score>)
|> Array.map (fun (cluster, scores) ->
// Cluster #
cluster,
// Extracts the score from ((<hotel name>, <score>), <cluster#>)
// fst>>snd navigates to the first tuple, second item
(scores |> Array.map (fst>>snd) |> Array.average))

// Turns it all into a map so I can do average score lookups based on cluster.
|> Map

Whew, now that is done. Time to see some results. The report is sorted by cluster number and hotel score (descending).

1
2
3
4
printfn "%7s %-55s %5s %s" "Cluster" "Hotel" "Score" "ClusterScore"
combinedData
|> Array.sortBy (fun (x, cluster) -> cluster, (snd x) * -1.)
|> Array.iter (fun (x, cluster ) -> printfn "%7d %-55s %0.2f %0.2f" cluster (fst x) (snd x) (avgClusterScore.Item cluster))

Based on relative ammenties (and 5 clusters), here are the results. With a small bit of code I’ve gone from data file to cluster score hotel comparisons.

1
2
3
4
5
6
7
8
9
10
11
12
13
14
15
16
17
18
19
20
21
22
Cluster Hotel                                                   Score ClusterScore
0 Wynn Las Vegas 4.63 4.18
0 The Venetian Las Vegas Hotel 4.58 4.18
0 Encore at wynn Las Vegas 4.54 4.18
0 The Palazzo Resort Hotel Casino 4.38 4.18
0 Trump International Hotel Las Vegas 4.38 4.18
0 The Cosmopolitan Las Vegas 4.25 4.18
0 Bellagio Las Vegas 4.21 4.18
0 Caesars Palace 4.13 4.18
0 Tropicana Las Vegas - A Double Tree by Hilton Hotel 4.04 4.18
0 Paris Las Vegas 4.04 4.18
0 Treasure Island- TI Hotel & Casino 3.96 4.18
0 The Westin las Vegas Hotel Casino & Spa 3.92 4.18
0 Monte Carlo Resort&Casino 3.29 4.18
1 Marriott's Grand Chateau 4.54 4.36
1 Wyndham Grand Desert 4.38 4.36
1 Hilton Grand Vacations on the Boulevard 4.17 4.36
2 The Cromwell 4.08 4.08
3 Hilton Grand Vacations at the Flamingo 3.96 3.58
3 Circus Circus Hotel & Casino Las Vegas 3.21 3.58
4 Tuscany Las Vegas Suites & Casino 4.21 3.96
4 Excalibur Hotel & Casino 3.71 3.96

I want to backtrack now, and investigate the cluster details.

Where are the centroids for each cluster?

1
2
3
4
5
6
7
8
clusters.Centroids

val it : float [] [] =
[|[|1.0; 1.0; 0.2307692308; 1.0; 1.0; 0.9230769231; 4.615384615|];
[|1.0; 1.0; 0.3333333333; 0.3333333333; 0.6666666667; 1.0; 35.0|];
[|1.0; 0.0; 0.0; 0.0; 1.0; 1.0; 45.0|];
[|0.5; 1.0; 0.0; 0.0; 0.5; 1.0; 3.0|];
[|1.0; 1.0; 0.5; 1.0; 1.0; 1.0; 3.0|]|]

What are the cluster details?

1
2
3
4
5
6
7
8
9
10
11
12
13
14
15
16
17
18
19
20
21
22
clusters.Clusters
|> Array.iter(fun cluster ->
printfn "%d %0.2f" cluster.Index cluster.Proportion // Index and proportion of data
printfn " %A" cluster.Centroid // Centroids (like above)
printfn " %A" cluster.Covariance // Covariances
)

0 0.62
[|1.0; 1.0; 0.2307692308; 1.0; 1.0; 0.9230769231; 4.615384615|]
[|[|0.0; 0.0; 0.0; 0.0; 0.0; 0.0; 0.0|]; [|0.0; 0.0; 0.0; 0.0; 0.0; 0.0; 0.0|]; ...|]
1 0.14
[|1.0; 1.0; 0.3333333333; 0.3333333333; 0.6666666667; 1.0; 35.0|]
[|[|0.0; 0.0; 0.0; 0.0; 0.0; 0.0; 0.0|]; [|0.0; 0.0; 0.0; 0.0; 0.0; 0.0; 0.0|]; ...|]
2 0.05
[|1.0; 0.0; 0.0; 0.0; 1.0; 1.0; 45.0|]
[|[|nan; nan; nan; nan; nan; nan; nan|]; [|nan; nan; nan; nan; nan; nan; nan|]; ...|]
3 0.10
[|0.5; 1.0; 0.0; 0.0; 0.5; 1.0; 3.0|]
[|[|0.5; 0.0; 0.0; 0.0; -0.5; 0.0; 0.0|]; [|0.0; 0.0; 0.0; 0.0; 0.0; 0.0; 0.0|]; ...]|]
4 0.10
[|1.0; 1.0; 0.5; 1.0; 1.0; 1.0; 3.0|]
[|[|0.0; 0.0; 0.0; 0.0; 0.0; 0.0; 0.0|]; [|0.0; 0.0; 0.0; 0.0; 0.0; 0.0; 0.0|]; ...|]

What is the calculated error?

1
2
3
kmeans.Error

val it : float = 0.467032967

Taking this a little further. How many clusters should be used? What are the clustering dynamics? There are 21 hotels with 7 dimensions. My gut feeling is somewhere between 3 and 7 clusters probably makes sense. That should be enough to provide some distinction, but allow for large enough groupings to be useful. When generating the clusters, the initial centroids are random. This means the data could be clustered differently depending on starting points. To test this I’ll look at between 2 and 15 clusters. I’ll also run 100 trials per cluster size, and average the error score for that cluster. This should give a reasonable view into the clustering performance.

1
2
3
4
5
6
7
8
9
10
11
12
13
14
15
16
17
18
19
20
21
22
23
24
25
26
27
28
29
30
31
32
33
34
[2..15]
|> List.map (fun k ->
let error =
[0..100]
|> List.map (fun trial ->
let kmeans = new KMeans(k)
let clusters = kmeans.Learn(dataValues)
let labels = clusters.Decide(dataValues)
kmeans.Error)
|> List.average
k, error)
|> List.map (fun (k, error) ->
printfn "%2d %0.2f" k error
(k,error))
|> Chart.Line
|> Chart.WithXAxis(Title = "Clusters (k)")
|> Chart.WithYAxis(Title = "Error")
|> Chart.Show

// Results
2 4.61
3 1.62
4 0.85
5 0.45
6 0.35
7 0.28
8 0.21
9 0.17
10 0.11
11 0.07
12 0.03
13 0.00
14 0.00
15 0.00

Error Chart

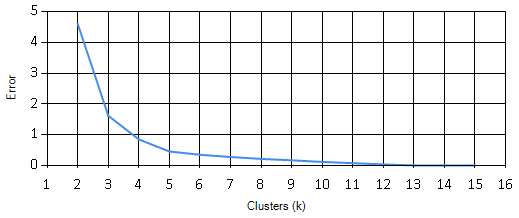
Looking at the results, error goes down as k goes up. This makes sense, with only 7 ammenity dimensions, most of them being standard, distinction completely falling off at around 12 clusters. But that’s not useful. So I can’t just take the smallest error. The most dramatic error reduction happens at 4 clusters, but the slope seems to really level off after k=5. From these results 4 or 5 seem like reasonable bets. I choose 5 because it provides a bit more separation, and it’s a prime number. :)

With all this done. I have a reasonable expectation that I’m clustering properly. I can now go back to the original report and see how similar hotels compare. This post has just been one example of how you can use K-Means clustering. I hope you found it useful. Until next time…

References
[1] ref: Moro, S., Rita, P., & Coelho, J. (2017). Stripping customers’ feedback on hotels through data mining: The case of Las Vegas Strip. Tourism Management Perspectives, 23, 41-52.